One can conduct the analysis by drawing a path diagram. To start, click the “Path Diagram” button. The interface below will appear:
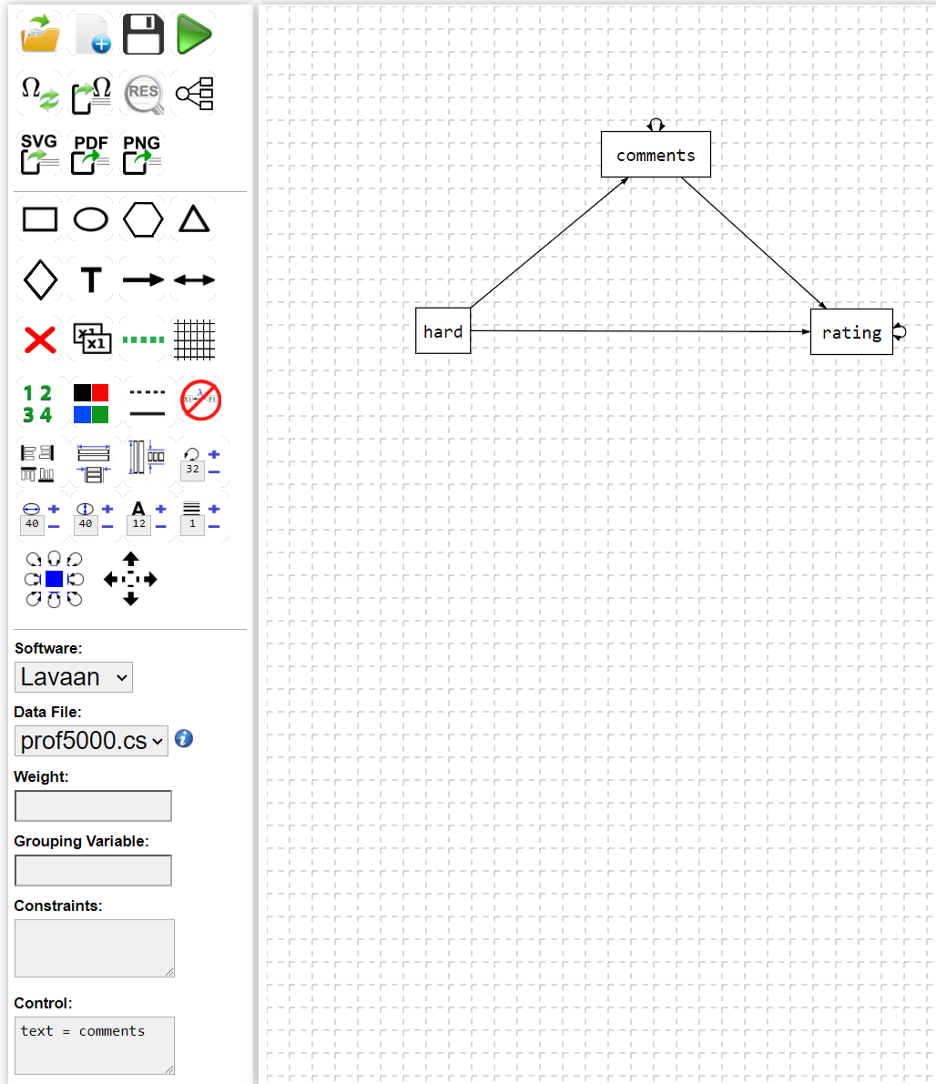
A path diagram can be drawn through the buttons in the interface. In the example, we have a mediation model where the text is used as a mediator for the association of “hard” (how difficulty the class is) and “rating” (the numerical rating of the class).
Different from a regular SEM, we need to specify the variable “comments” as a text variable by setting “text = comments” in the “Control” field. The app also supports different methods including dictionary based sentiment analysis, AI based method (setting “textmethod=ai”, and embedding method (setting “textmethod=embedding”).
With that, one can click on the run button (the green arrow) to carry out the analysis. For example, for the current model, we have the output as below. It mainly has two parts - the data description and the model results.
Descriptive statistics (N=5000)
                Mean        sd     Min       Max    Skewness Kurtosis
id        1.4343e+04 8314.0453  9.0000 28521.000  5.7205e-03   1.7654
profid    4.8633e+02  299.9069  1.0000  1000.000  2.9661e-02   1.7294
rating    3.8618e+00    1.4581  1.0000     5.000 -9.5170e-01   2.4063
hard      2.8908e+00    1.3156  1.0000     5.000  5.7725e-02   1.8941
sentiment 2.0682e-01    0.2668 -1.4732     1.803 -6.3469e-04   4.6312
          Missing Rate
id                   0
profid               0
rating               0
hard                 0
sentiment            0
Model information
Observed variables: hard comments rating .
Text variables: comments .
The weight is: 0 .
The software to be used is: TextSEM
lavaan 0.6-12 ended normally after 20 iterations

  Estimator                                         ML
  Optimization method                           NLMINB
  Number of model parameters                         9

  Number of observations                          5000
  Number of missing patterns                         1

Model Test User Model:

  Test statistic                                 0.000
  Degrees of freedom                                 0

Model Test Baseline Model:

  Test statistic                              4142.684
  Degrees of freedom                                 3
  P-value                                        0.000

User Model versus Baseline Model:

  Comparative Fit Index (CFI)                    1.000
  Tucker-Lewis Index (TLI)                       1.000

Loglikelihood and Information Criteria:

  Loglikelihood user model (H0)             -15862.021
  Loglikelihood unrestricted model (H1)     -15862.021

  Akaike (AIC)                               31742.042
  Bayesian (BIC)                             31800.696
  Sample-size adjusted Bayesian (BIC)        31772.098

Root Mean Square Error of Approximation:

  RMSEA                                          0.000
  90 Percent confidence interval - lower         0.000
  90 Percent confidence interval - upper         0.000
  P-value RMSEA <= 0.05                             NA

Standardized Root Mean Square Residual:

  SRMR                                           0.000

Parameter Estimates:

  Standard errors                             Standard
  Information                                 Observed
  Observed information based on                Hessian

Regressions:
                          Estimate  Std.Err  z-value  P(>|z|)
  comments.OverallSenti ~
    hard                    -0.075    0.003  -28.208    0.000
  rating ~
    cmmnts.OvrllSn           2.829    0.059   47.785    0.000
    hard                    -0.355    0.012  -29.605    0.000

Intercepts:
                   Estimate  Std.Err  z-value  P(>|z|)
   .cmmnts.OvrllSn    0.424    0.008   50.120    0.000
   .rating            4.304    0.043   99.150    0.000
    hard              2.891    0.019  155.389    0.000

Variances:
                   Estimate  Std.Err  z-value  P(>|z|)
   .cmmnts.OvrllSn    0.061    0.001   50.000    0.000
   .rating            1.076    0.022   50.000    0.000
    hard              1.730    0.035   50.000    0.000